Security Detection Playground - Part 3
Introduction
Welcome to Part 3 of my walkthrough for building a hands-on threat detection lab. In part 1, we set up Proxmox, along with OPNsense to act as a firewall/router in front of our lab network. We also set up a WireGuard tunnel to allow us to access machines within the lab network. In part 2, we set up Elasticsearch on a VM, ingested some NetFlow logs from OPNsense, and created an alert based on that data. In this post, we’ll cover the fundamentals of custom log ingestion, including the underlying theory and best practices. We’ll also walk through a practical example by ingesting audit logs from OPNsense. Finally, we’ll create a custom alert rule based on the newly ingested logs.
A Bit About Log Ingestion Theory
Now that we’ve got some data flowing into Elasticsearch, it’s time to look at how to bring in custom logs, by which I mean logs from sources that don’t have pre-built integrations that do the parsing for us. In this section, we’ll cover the general process for ingesting logs that aren’t plug-and-play.
Before we jump in, it’s worth quickly reviewing how logs work inside a SIEM like Elasticsearch. Logs give us visibility—into authentication attempts, traffic patterns, command execution, and more. But raw logs alone aren’t super useful unless we can parse them into fields like source.ip or event.outcome. That’s what enables us to search, visualize, and write alerts. So when working with custom logs, a big part of the job is figuring out how to cleanly extract those fields.
Steps for Ingesting Custom Logs
When working with custom logs—logs from sources without built-in integrations—the ingestion process usually follows these steps:
-
Collect Sample Logs Start by gathering a set of sample logs from your source system. This gives you a representative snapshot of the log formats, field structures, and possible variations you’ll need to handle.
-
Analyze the Log Format Review the samples to identify which parts of the logs are important (e.g., IPs, timestamps, usernames) and which are repetitive or noisy. AI tools can be a big help here—they can summarize log patterns, highlight anomalies, or even generate draft parsing rules like grok patterns or dissect configurations.
-
Design a Parsing Strategy Choose the right parsing method for your log format. This could be:
- Grok patterns for structured but flexible formats
- Dissect processors for delimiter-based logs
- Regex for more complex parsing cases
Focus on performance—avoid overly complex expressions that waste CPU cycles.
-
Build and Test the Parser Implement the parsing logic using your SIEM’s preferred method—this could be an ingest pipeline in Elasticsearch, a Logstash config, or another parser. Test against a wide variety of sample logs to confirm that all relevant fields are being extracted consistently.
-
Create a Data Stream or Routing Pipeline Set up routing so that the logs are sent through your parser and stored in the right place (e.g., a dedicated index or data stream in Elasticsearch). This makes management and querying much easier later on.
-
Verify and Iterate In Kibana (or whatever front end you’re using), check the parsed logs in Discover. Look for missing fields, inconsistencies, or unexpected values. You’ll usually need to tweak your parsing a few times before it’s dialed in. AI can help troubleshoot parsing issues or optimize your logic.
-
Build Alerts and Dashboards Once your logs are structured properly, you can create custom alerts, visualizations, and dashboards. Clean parsing is what enables powerful queries and accurate detection rules.
By following this general process, you’ll be able to ingest just about any custom log source into Elasticsearch cleanly and reliably.
Ingesting Audit Logs From OPNsense
Obtaining a log sample
As laid out above, our first step is to get a sample of the logs from OPNsense. This is easy enough to do, as the logs are actually accessible through the GUI. They can be accessed under System > Log Files > Audit, and you can download a log file using the button in the bottom right corner. Before doing so, however, you should generate some unsuccessful logins in a private browser window so that we can see what login failures look like in the logs.
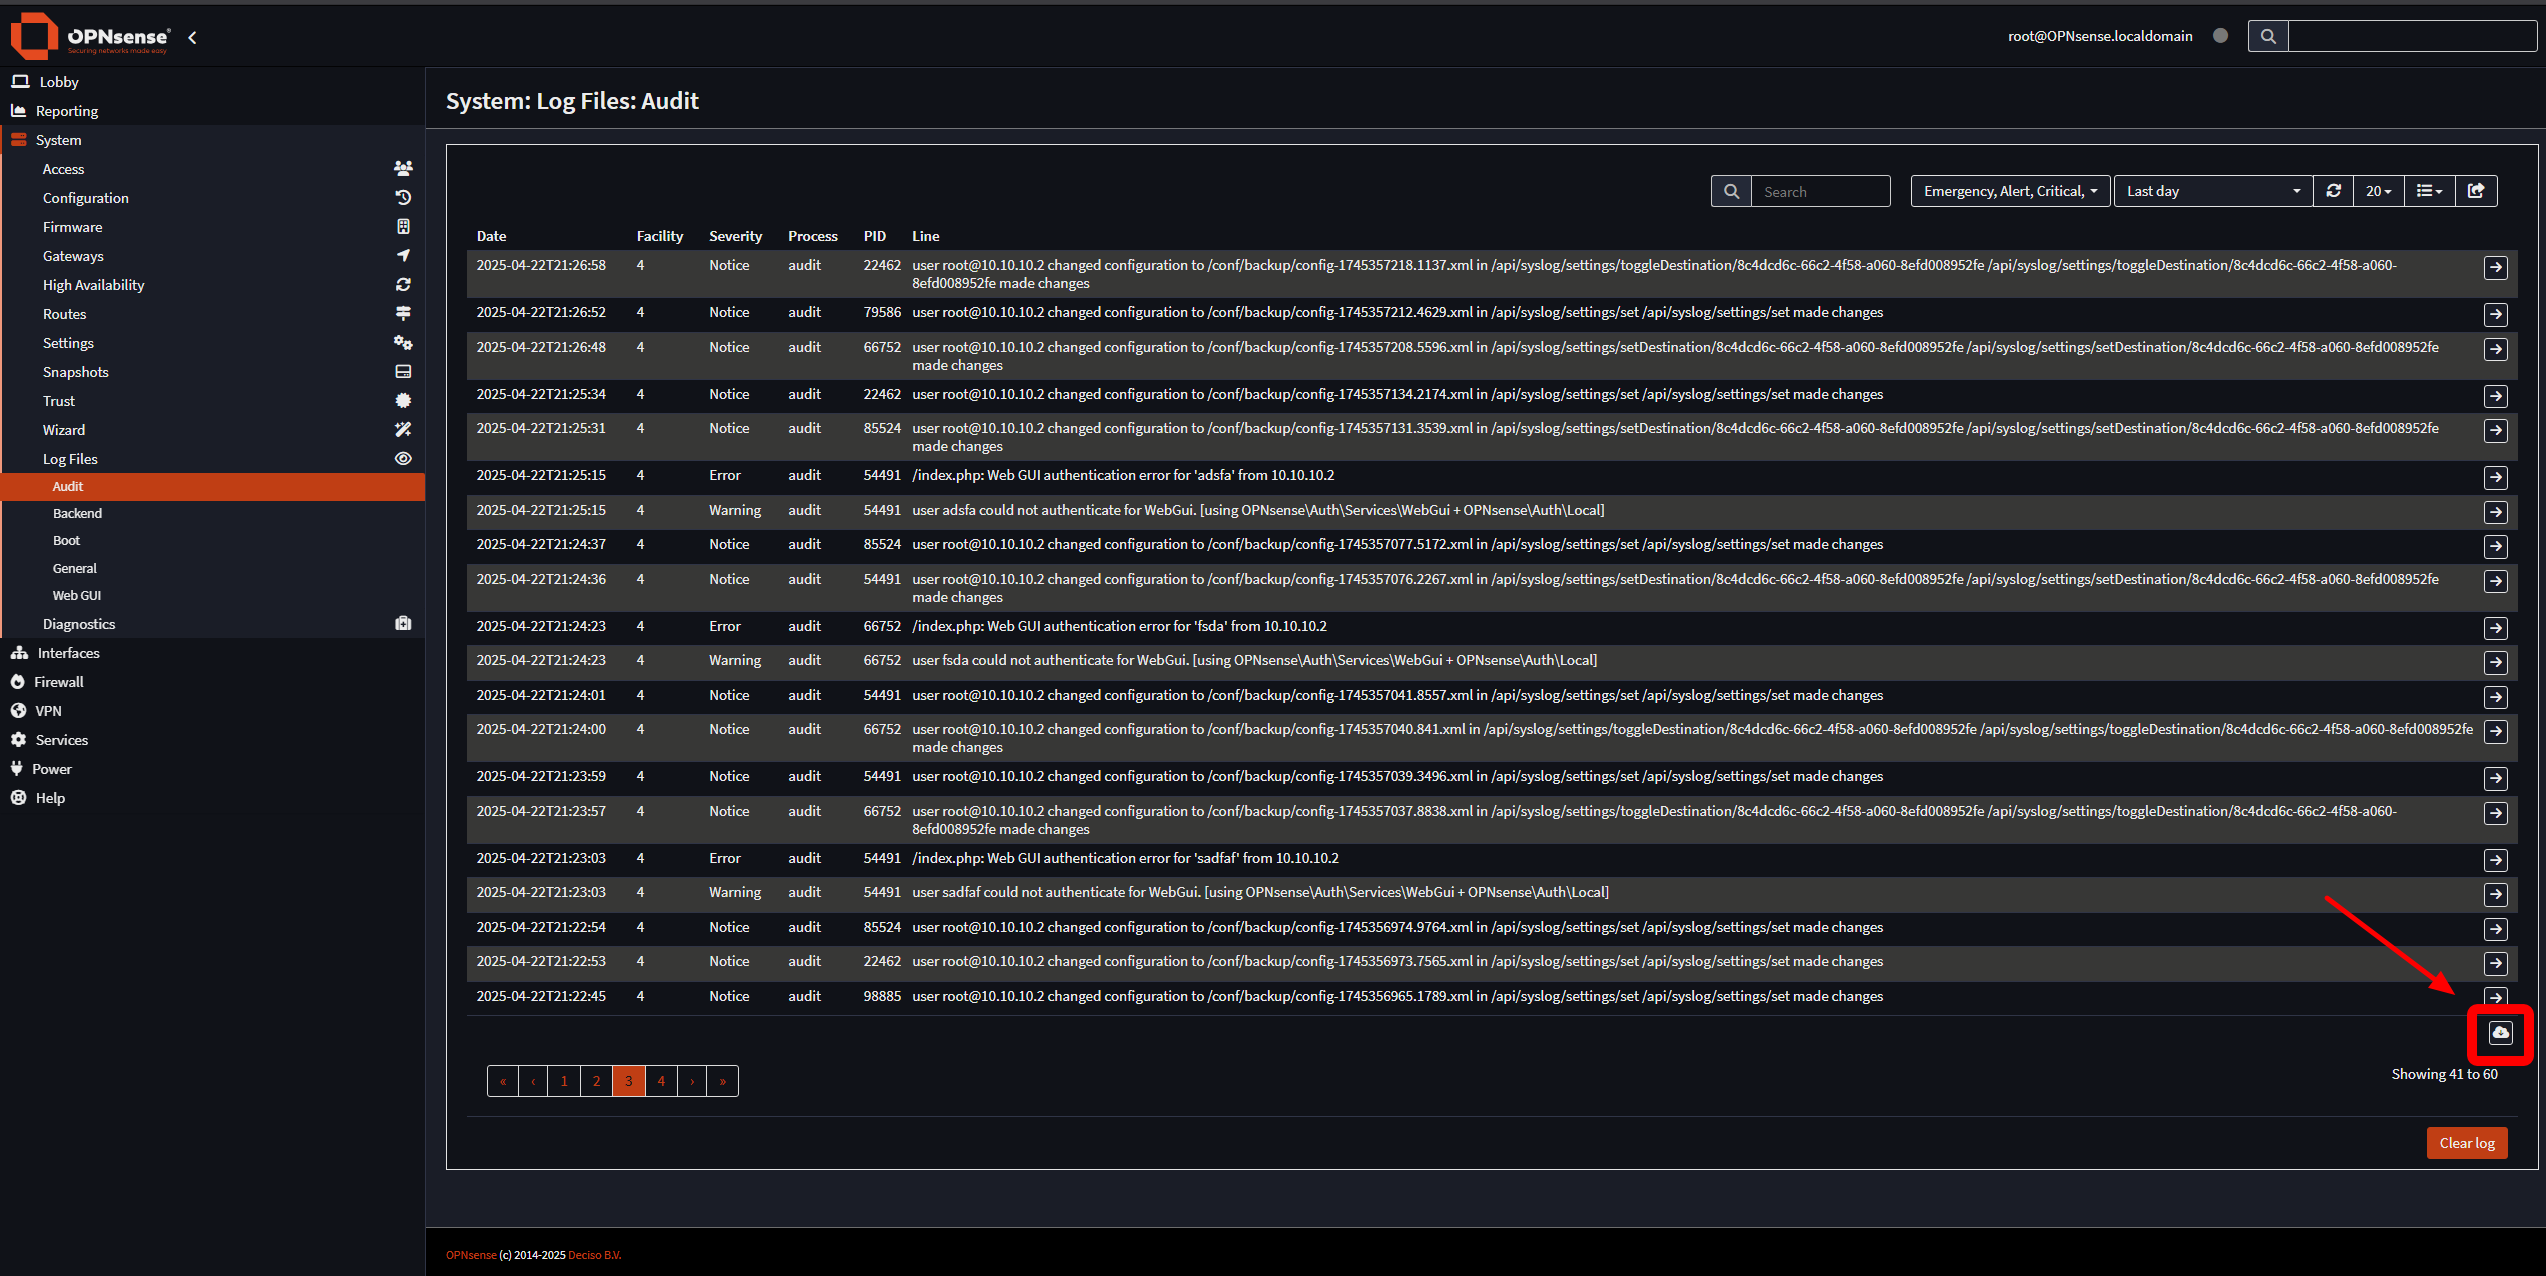
You should note that the way logs are formatted in the downloaded file is not exactly how they will be shipped to Elasticsearch. They are formatted by OPNsense when downloaded. To get a true sense of what the logs look like, you can enable SSH in the OPNsense administrator settings and view and download the actual log file located at /var/log/audit/latest.log.
If you do so, you will see that it actually looks something like this:
|
|
It appears that the logs are formatted in the standard syslog RFC5424 format, and this is how the logs will be shipped to Elasticsearch. You will learn to recognize different standard log formats like syslog if you don’t already from experience. If you don’t know what format a log is in, you can always ask AI, which will almost certainly figure it out very quickly.
One gotcha that gave me a bit of trouble was that the OPNsense built-in log forwarding functionality will only forward the
auditlogs (the logs that haveauditafterOPNsense.localdomainin the message), and not the logs from thesshdprocess. This unfortunately means we will not be able to see which IP the SSH logins come from. In a production environment, I would set up a custom logging solution, potentially going as far as installing an Elastic Agent on the firewall to collect those logs, as they are pretty important.
To write our parser, we only want the main message body of the log, and not the syslog metadata, as that will be parsed automatically by the ingest pipeline we set up later. To create a file with just the messages from the log that we downloaded from the UI, run this bash one-liner on it (I use WSL for this): We can then extract the logs using a bash one-liner (I use WSL for this):
|
|
Analyzing the logs
Once you have a log sample, take a look to see if you can spot patterns and specific messages that you want to keep and which ones you want to discard. Here are a few things that stood out to me when I looked at our log sample, in no particular order:
- I probably want to keep the logs that say a configuration was changed, indicated by lines like this:
user [email protected] changed configuration to /conf/backup/config-1745449222.9623.xml in /system_advanced_admin.php /system_advanced_admin.php made changes. I would also like to make sure that the user and IP are parsed as separate fields to better search and filter for these events. - I want to keep messages that indicate successful logins that contain the username and IP address.
- For WebGUI logins, that looks like this:
/index.php: Successful login for user 'root' from: 10.10.10.2.
- For WebGUI logins, that looks like this:
- I want to keep messages that indicate failed logins that contain the username and IP address.
- For WebGUI logins, that looks like this:
/index.php: Web GUI authentication error for 'root' from 10.10.10.2.
- For WebGUI logins, that looks like this:
- For SSH logins, we can at least see the user that’s logging in. The logs look like so:
user root authenticated successfully for sshd [using OPNsense\Auth\Services\System + OPNsense\Auth\Local]. - For most of the remaining logs, I would want to keep them to try to get a good idea of what’s happening, but don’t necessarily need to parse individual information from them.
Creating a parsing strategy
Now that we have a good idea of what logs we want to keep and parse, we can come up with a basic strategy to do so. For the OPNsense logs, I would come up with something like the following:
- Create grok patterns to parse the fields from the messages that we know we want.
- Keep all the rest of the logs, keeping in mind that we can always add more grok patterns down the road if we find other logs that we want to parse.
- Some logs can benefit from enrichment, which is where you add information to each log based on a specific field by looking that field up in a table. For example, we might add a field with the hostname of any internal IP in the log so that we can get a better understanding of where logins are coming from. We won’t actually do that here, as we don’t have that kind of data right now, but it’s something that would be done at this stage in the log pipeline.
Building and testing the parser
Take a sample of about 20-30 lines from our previously trimmed log file from above that contains at least one of each of the important log types and save it.
The next step is to create grok patterns to parse individual messages from our log sample. We can get AI to do most of the heavy lifting here by uploading a sample of the logs and asking it to create grok patterns.
Upload the logs to any popular AI (I used the free version of Gemini 2.5 Pro) and prompt it with something like the following:
|
|
You may have to talk the AI through making some fixes, but you should get a very solid foundation. In my case, I got the following:
|
|
The reason why I asked for an API call is so that we can create the pipeline with the grok patterns already created in one shot. In our case, I actually don’t want the dissect or remove processors, or the USERNAME pattern definition, so I deleted them, and was left with the following:
|
|
The above can be pasted into the Elasticsearch Dev Tools console, which is under “Management” in the main menu. The Dev Tools also includes a grok debugger if you want to test and modify patterns on your own. Once you’ve created the pipeline in the Dev Tools, you should see it under Stack Management > Ingest Pipelines. One important thing we should change is toggling on “Ignore failures for this processor” in the Grok processor. This allows log lines that don’t fit any message to still pass through this processor without errors. Now that our pipeline is created, we can start testing it with our log sample. While trying to figure out the best way to write this up, I ended up vibe-coding an application to make testing Elastic pipelines easier. The built-in GUI doesn’t provide an easy way to just upload a sample of the logs and have it run through the ingest pipeline, so my application does just that, which should enable quicker testing and faster changes and iterations.
You will need Docker to run this application, but it can be run from your workstation, and connect via our WireGuard VPN. You can find the application on my GitHub. Download and run the app with the following:
|
|
The application should be available at http://localhost:8080/. Use your Elastic credentials to connect, then select the opnsense_audit_logs pipeline and paste or upload your log sample. After clicking “Process”, you should end up with something like this:
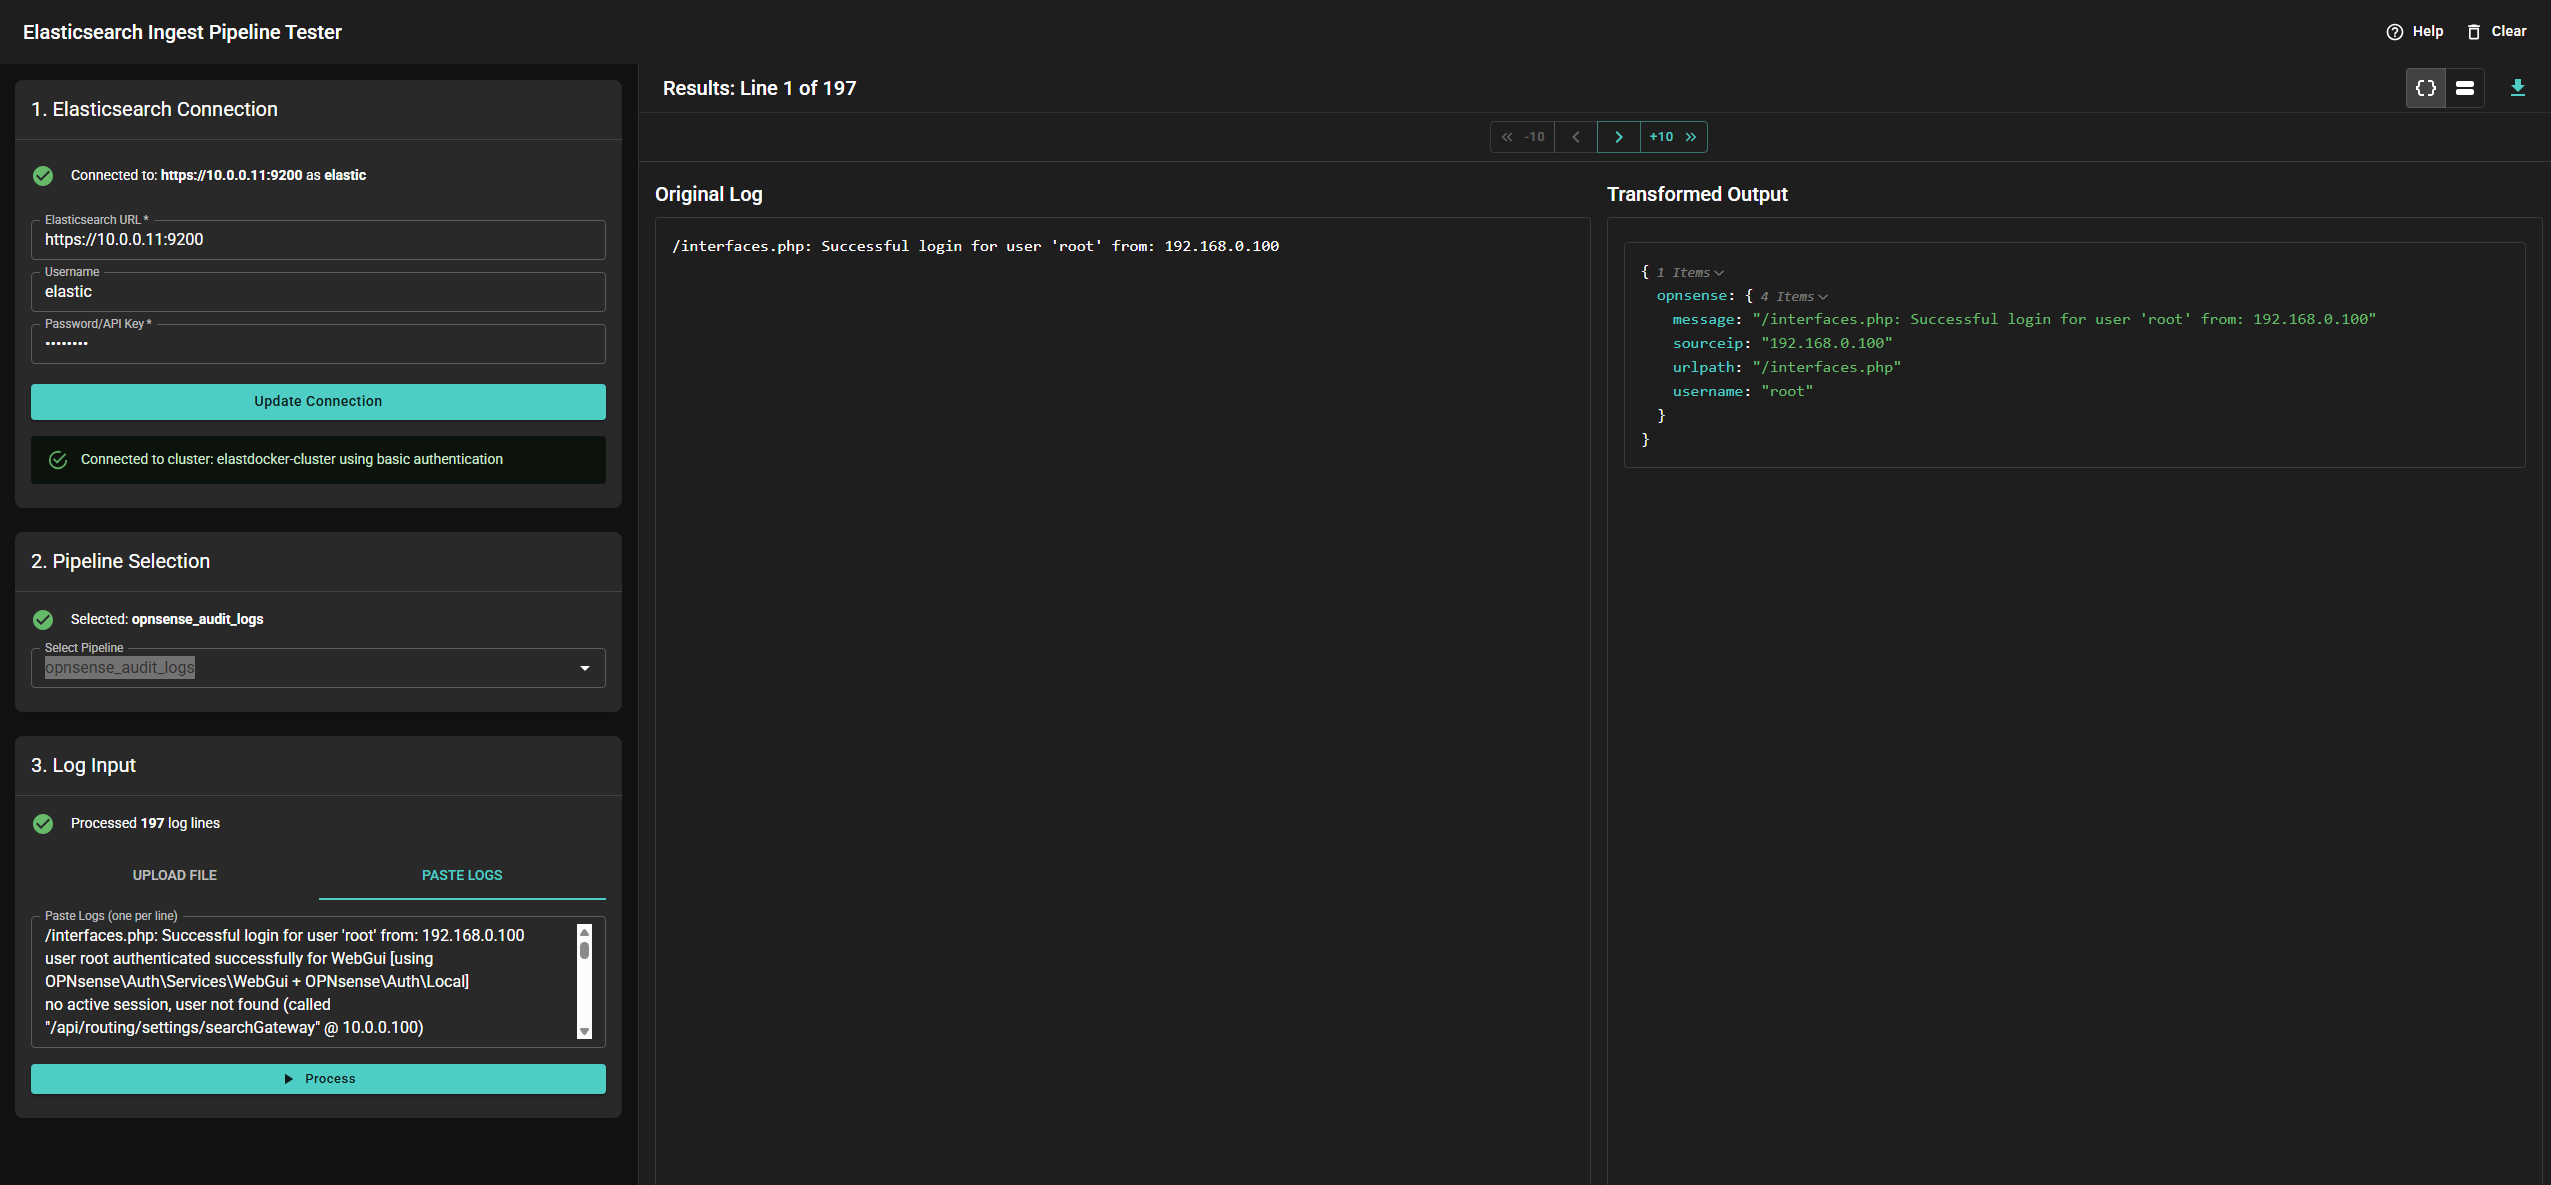 You can then use the arrows to go through your log sample and see how the log will be parsed.
You can make changes in the GUI and then run the logs through the processor again to see changes (make sure to save the pipeline first).
After some playing around, I ended up with the following:
You can then use the arrows to go through your log sample and see how the log will be parsed.
You can make changes in the GUI and then run the logs through the processor again to see changes (make sure to save the pipeline first).
After some playing around, I ended up with the following:
|
|
The set and remove processors will move the message field to be under the opnsense parent key, and then remove the old message field from the top level.
Once we have the logs parsing correctly, it’s time to create the listener for the logs.
Creating the listener and shipping the logs
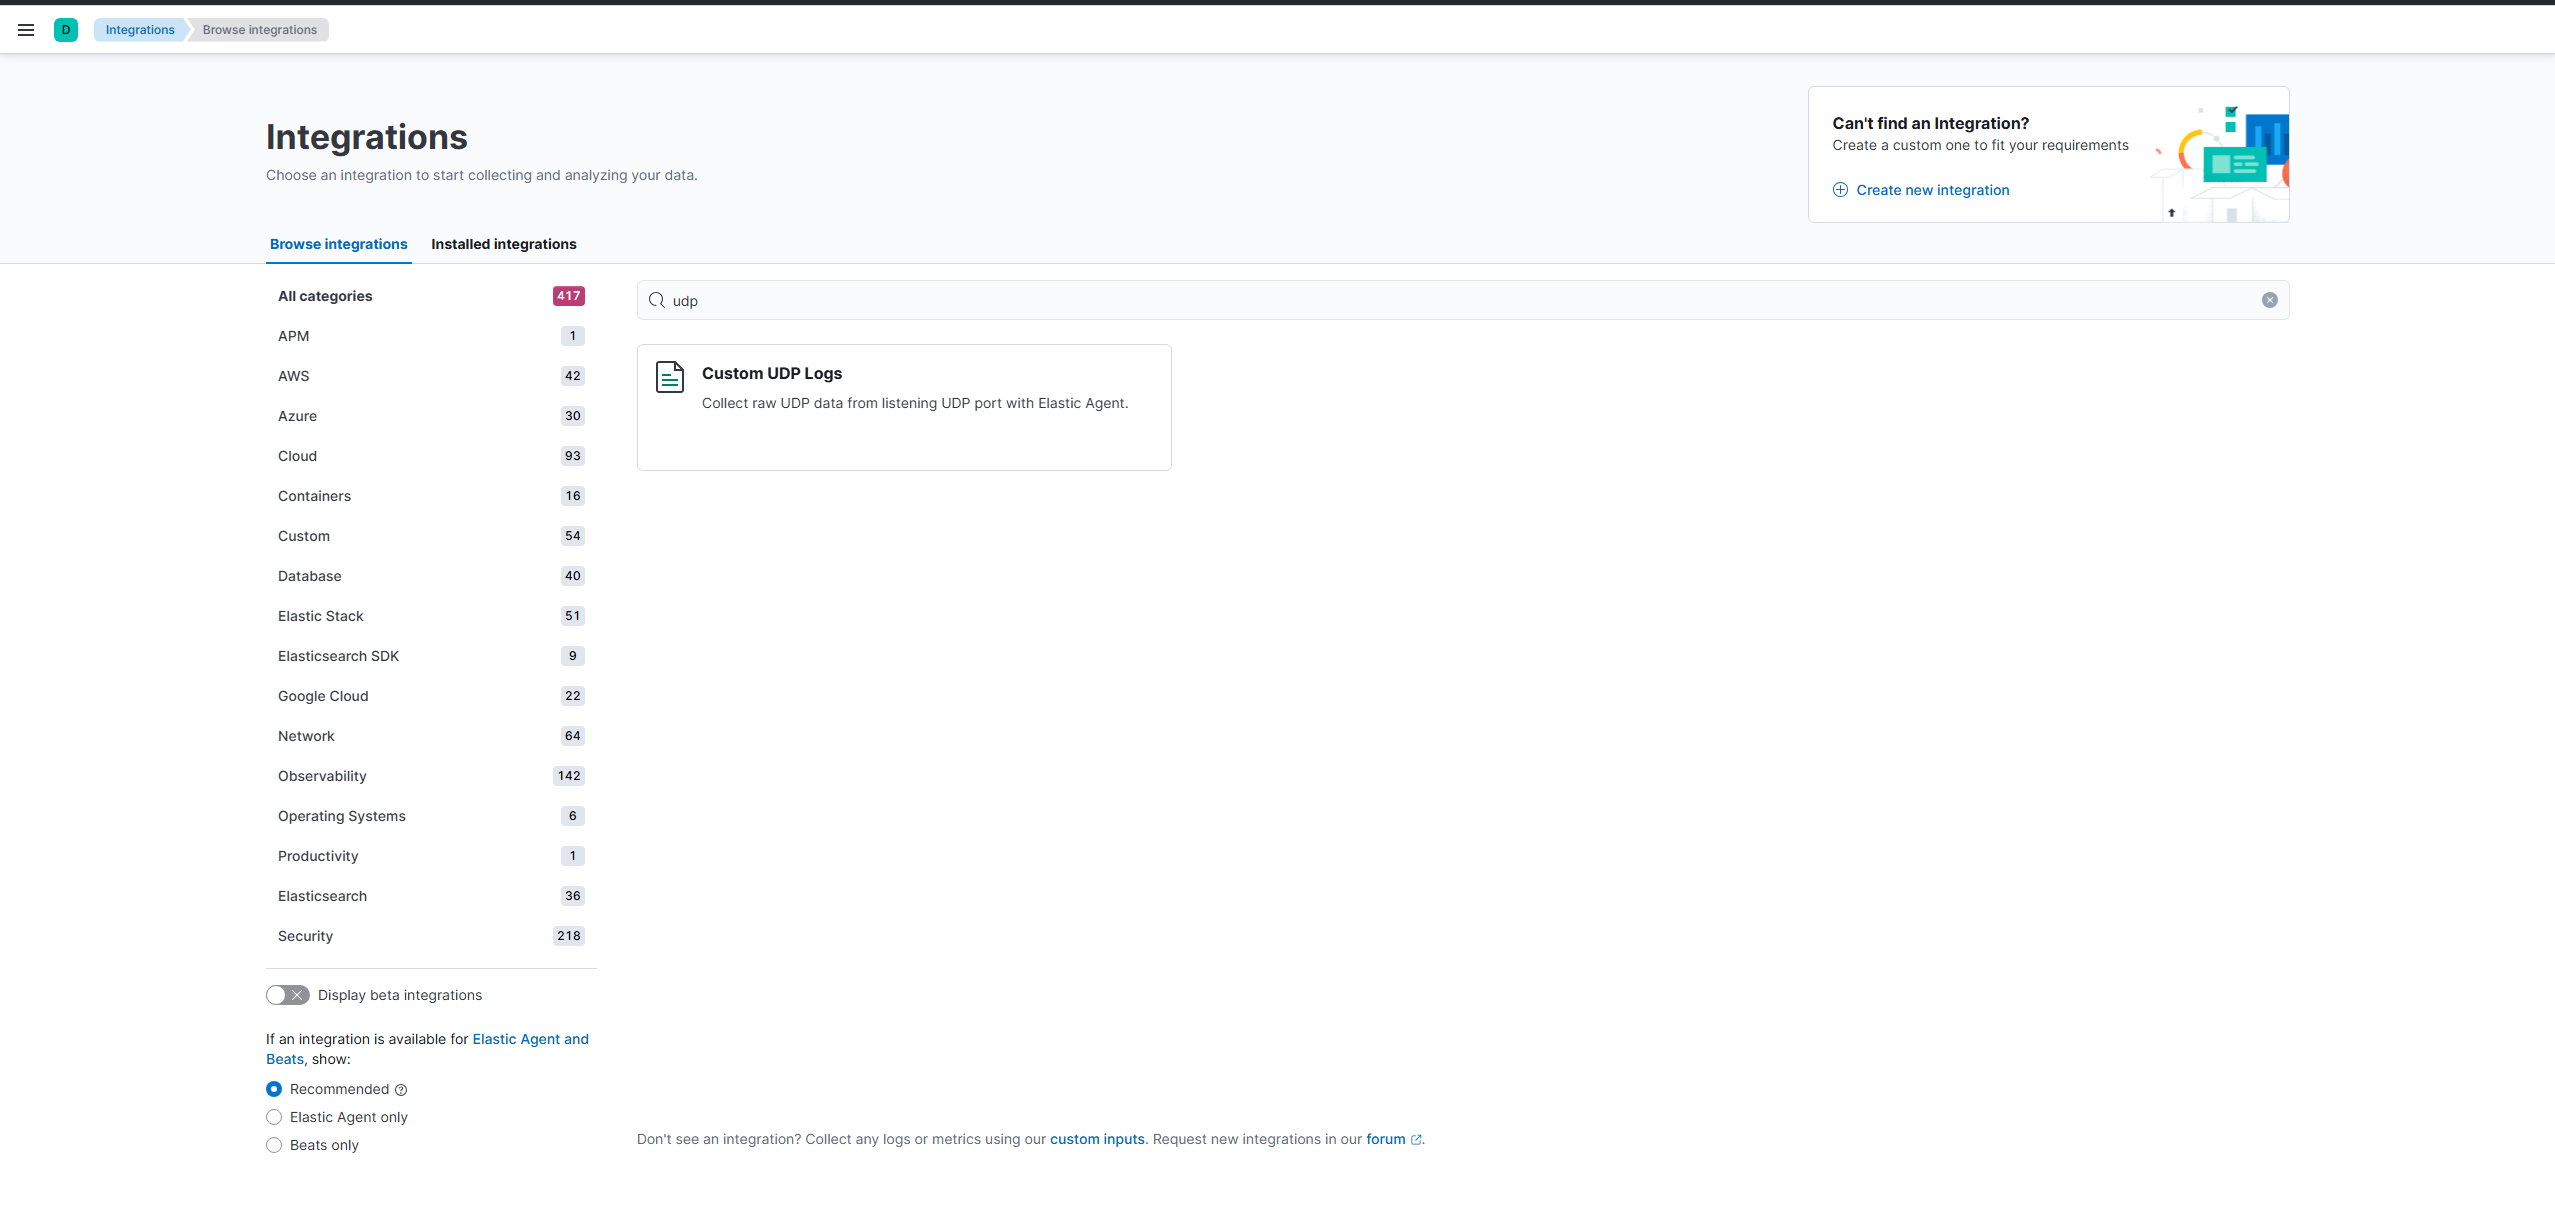
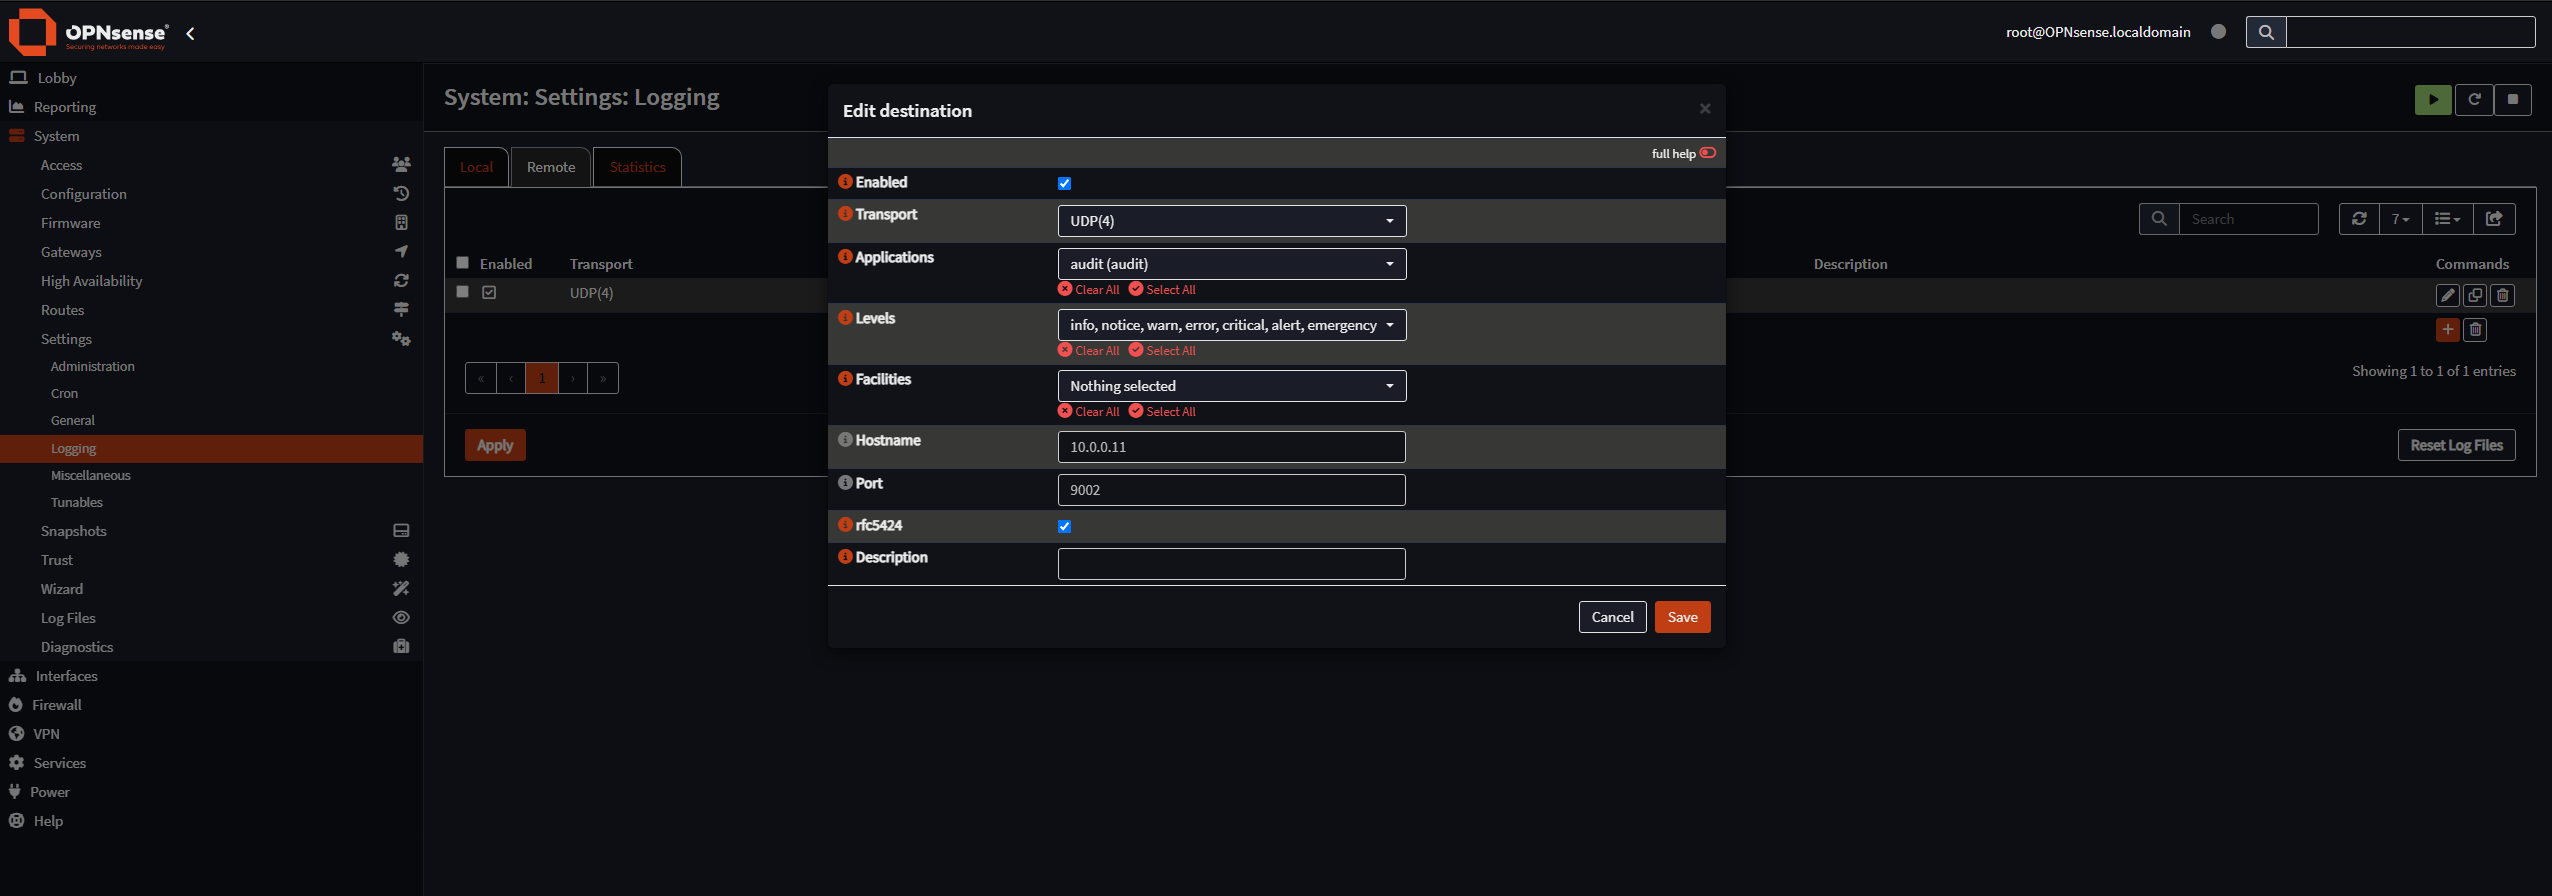
We’re going to create a custom integration on our Elastic Agent that will listen for custom UDP logs and parse them using the pipeline we just wrote. Start by adding a “Custom UDP Logs” integration to the existing Elastic Agent with the settings set like the image below:

Before sending logs, we will create a custom component template so that the IP addresses in our logs get stored as IP types in Elasticsearch, which allows things like searching by CIDR notation and will come in handy later when writing alerts. Create the custom template by running the following in the Dev Tools console:
|
|
Set OPNsense to forward the logs to our new listener (https://10.0.0.1/ui/syslog):
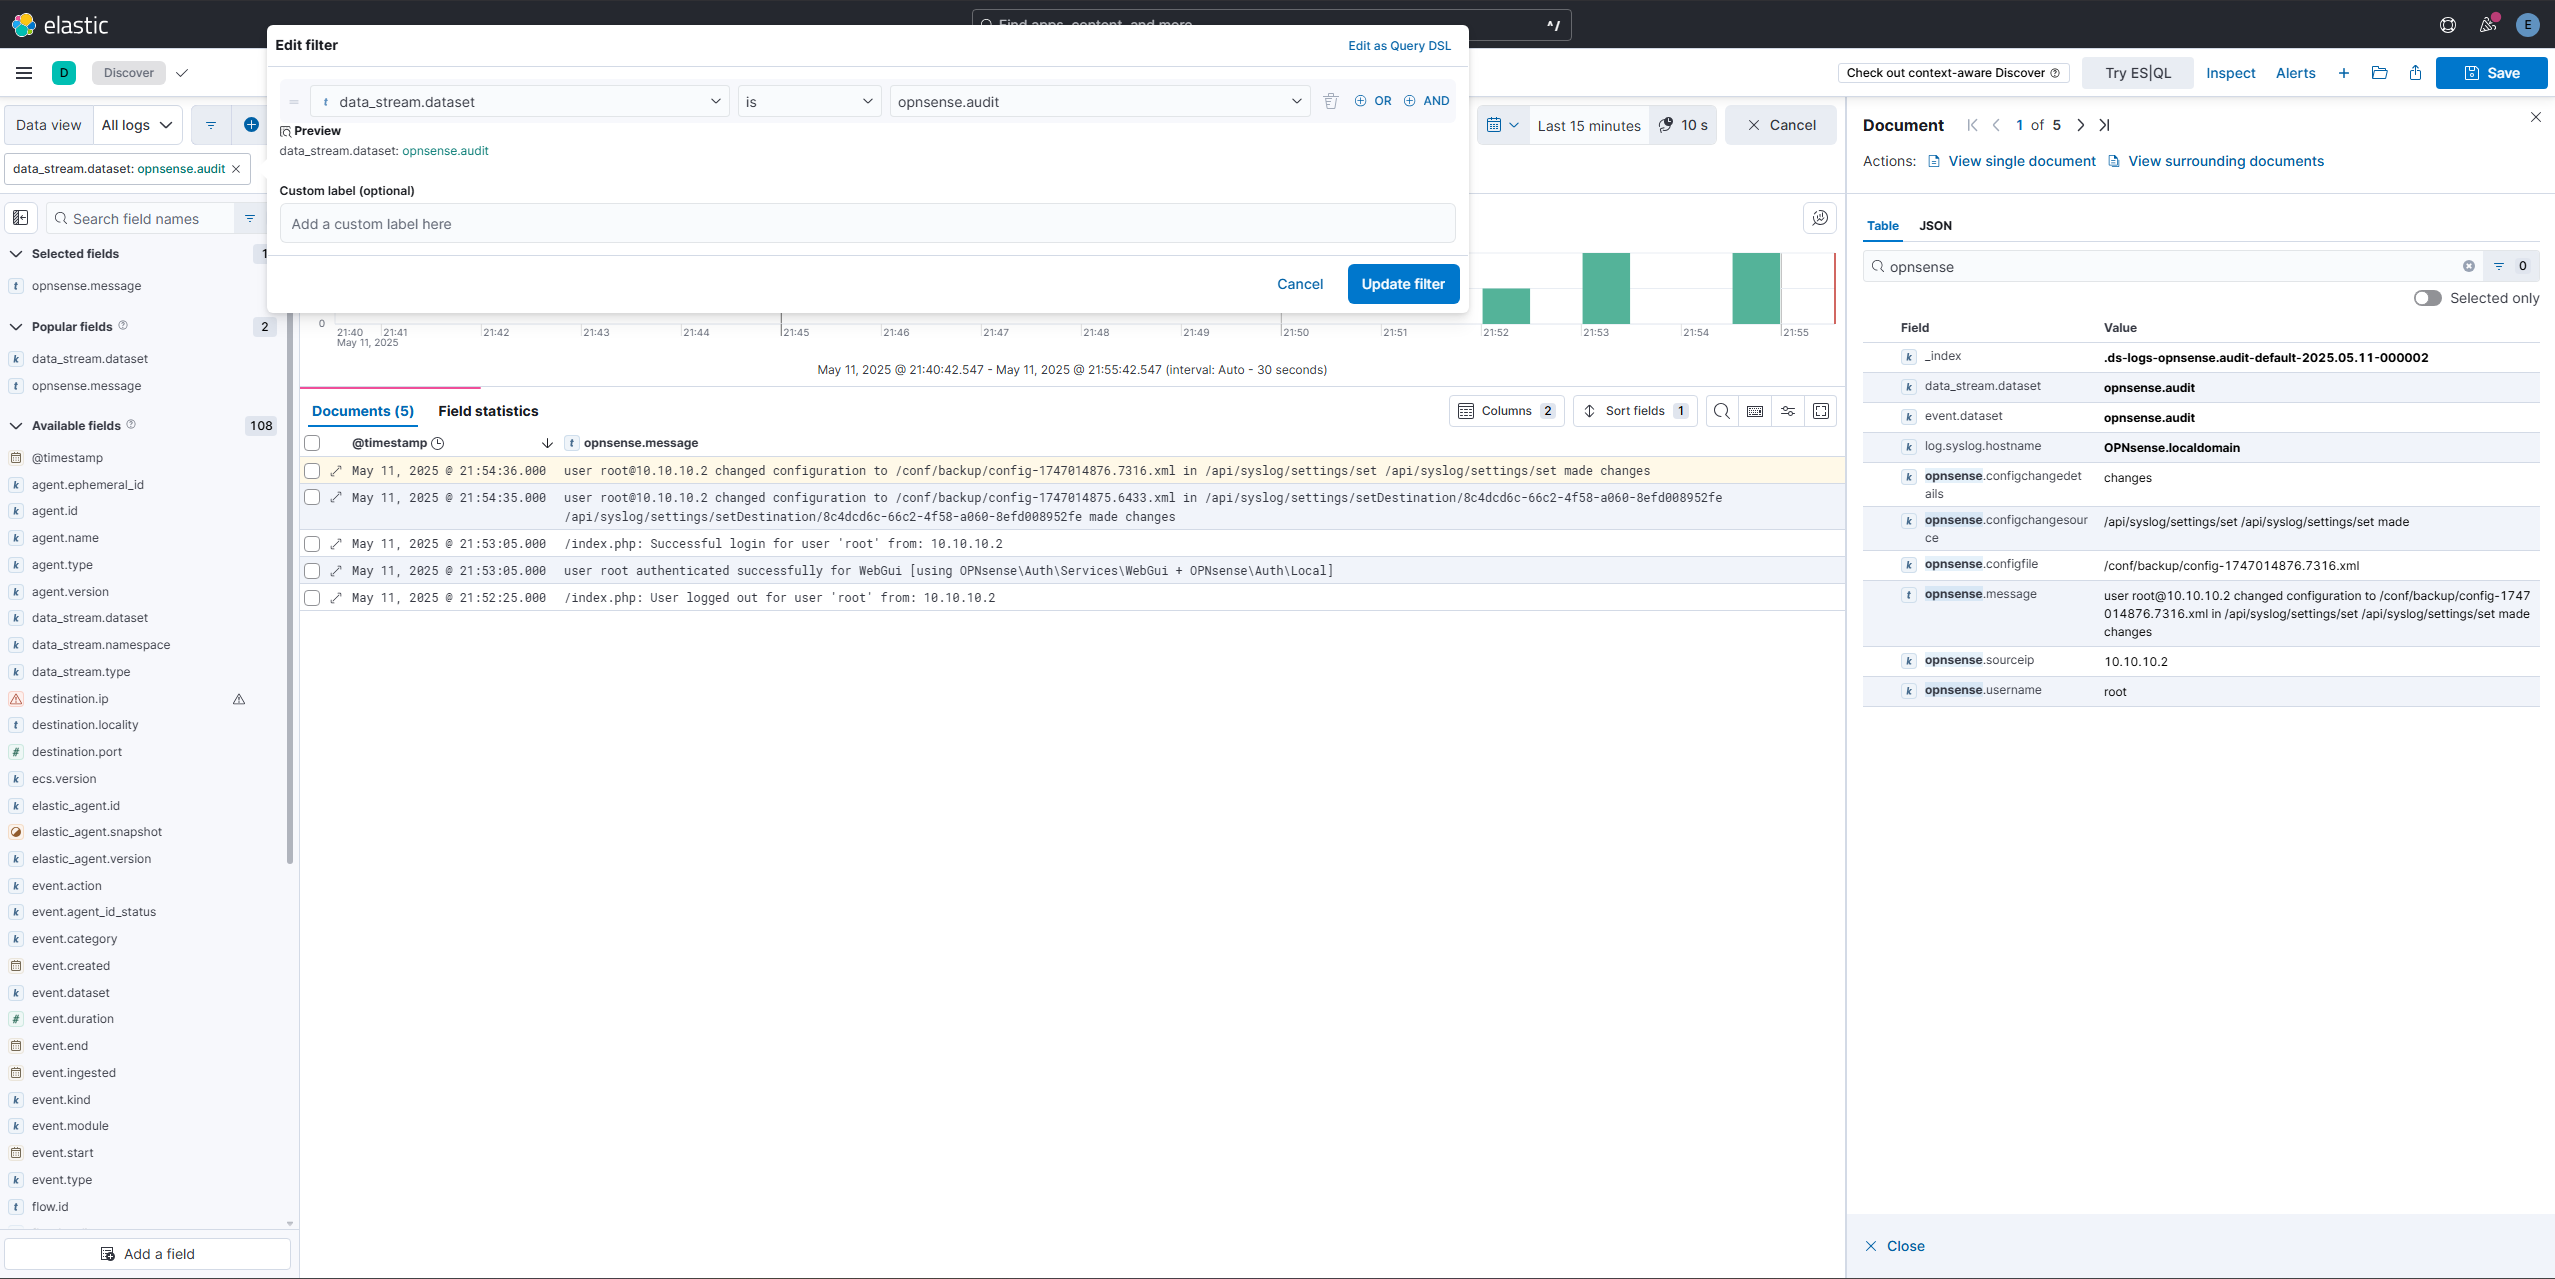
Log out and back in to generate a log, and you should see some logs in the “Discover” tab in Elastic:
Creating Detections and Alerts
Detecting potential bruteforcing attempts
Now that we have the OPNsense audit logs coming in, it’s time to write some alerts.
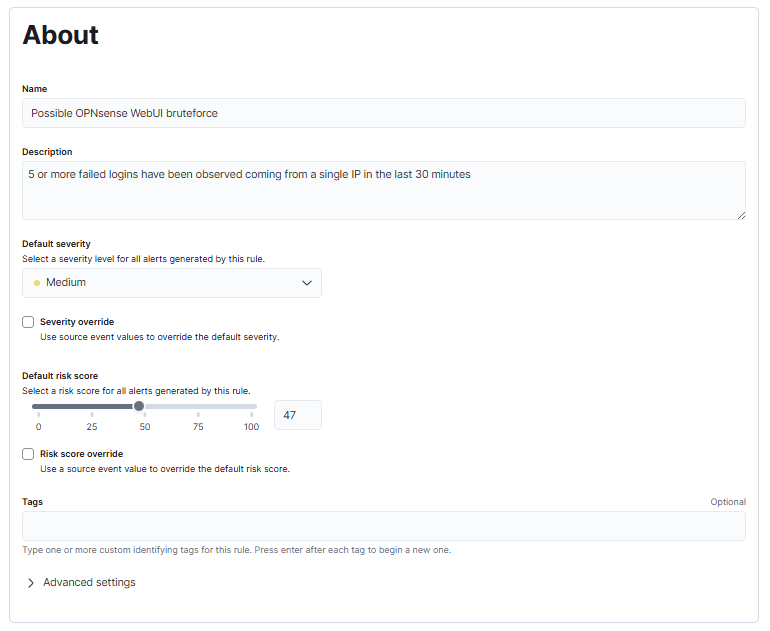
The first alert we will write will detect if the WebUI is being brute-forced, by configuring a rule to throw an alert if there are 5 or more failed logins coming from a single IP.
Create a rule and configure it like the following:
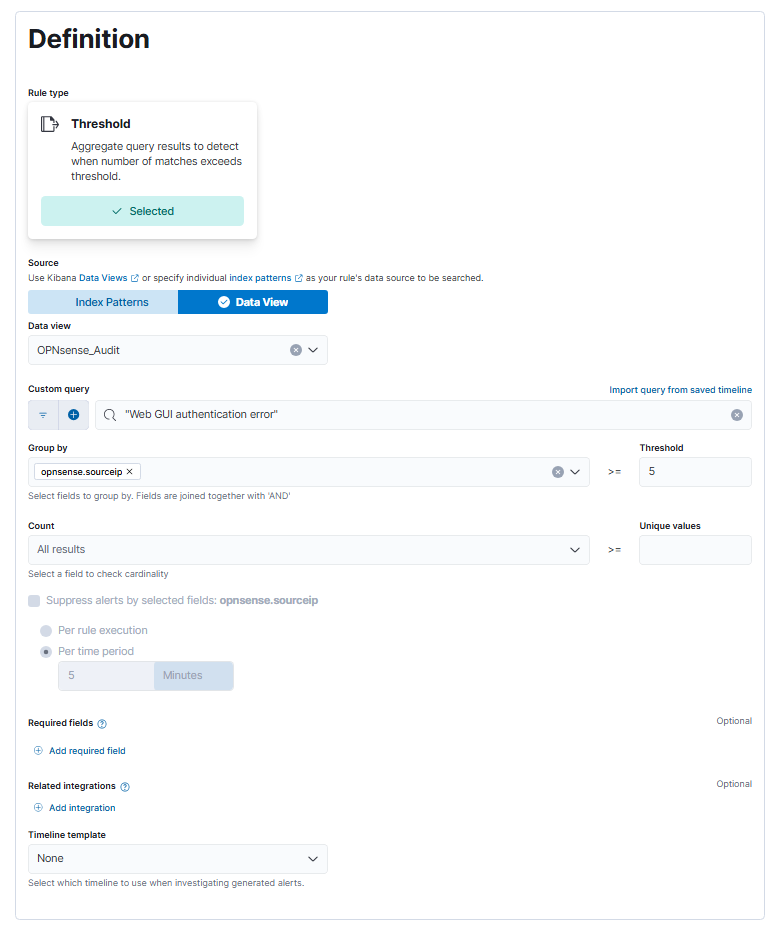
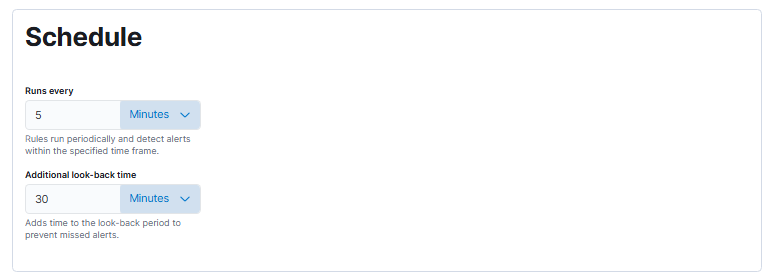
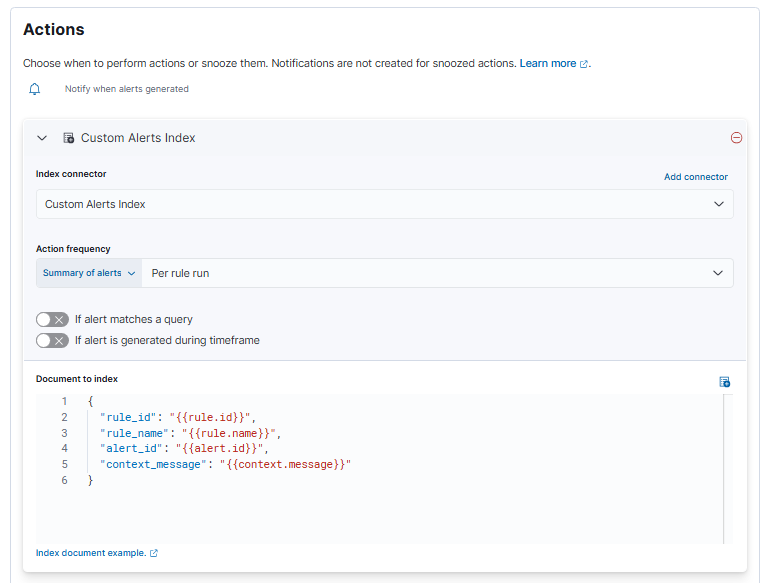
Note that I used a data view in the alert definition to narrow down which logs should be searched, with the index pattern being logs-opnsense.audit-default.
You can test the alert by opening a private browser window and generating 5 or more failed logins.
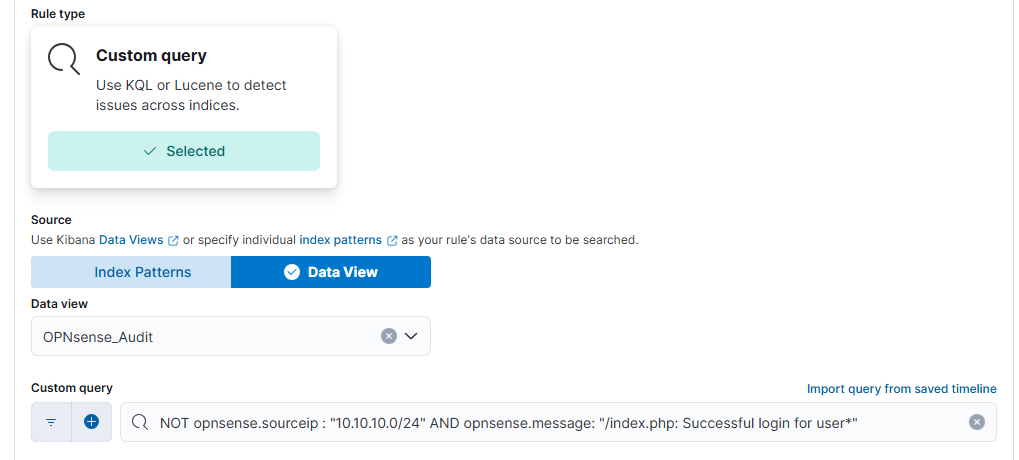
Detecting logins from suspicious locations
Next, we will create an alert to detect a login coming from an unexpected source. In our case, we only really expect logins to come from the VPN IP range (10.10.10.0/24), as that’s where our workstation is located. Thus any logins coming from the main network, aka 10.0.0.0/24 would be suspicious, and should be alerted upon.
We will do this by creating another rule of the type “Custom query” and configuring the query as:
|
|
You can test the detection by logging in with a browser and copying the request as a curl command in the Dev Tools, and then using that on the command line on the Elastic VM.
Conclusion
That’s it for this post. I encourage you to poke around and have a go at writing more detections, or trying to onboard more log sources from the huge choice of integrations offered by Elastic. In the next post, we’ll play around with Atomic Red Team and Elastic Security.